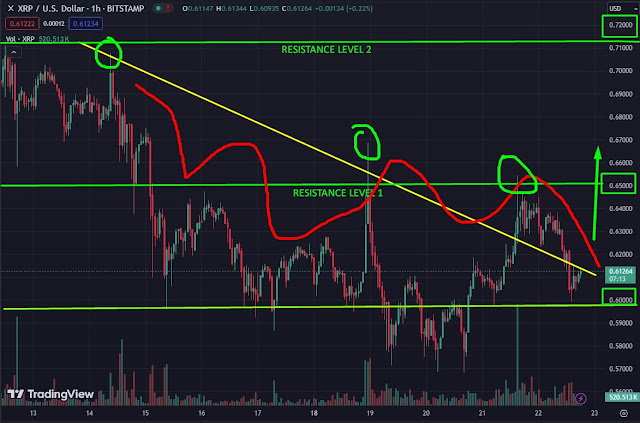
XRP chart analysis:
 |
| XRP 4 hour chart analysis |
XRP has shown signs of recovery by surpassing the crucial price mark of $0.60 recently. This increase comes after a period of decline. Now, it's aiming to challenge the resistance level at $0.6561. This resistance point is calculated by Fibonacci retracement, which helps to predict potential price movements based on past trends.
The journey ahead for XRP may encounter further hurdles at $0.7025 and $0.7440. These are considered as resistance levels, which means they could slow down or halt the upward movement of XRP's price. The Fair Value Gap (FVG), an area where the price might face significant challenges between $0.7527 and $0.7609.
Read more:
Crypto analysis: Bitcoin (BTC) and Cardano (ADA) chart analysis
 |
| BTC & ADA chart analysis |
However, it's not all smooth sailing for XRP. The Moving Average Convergence/Divergence (MACD) is signaling negative momentum. In simpler terms, this suggests that the cryptocurrency's recovery might not be easy. It requires consistent buying interest from traders to sustain its upward trajectory.
On the downside, if the positive momentum falters, XRP's price might retreat to $0.6057. This level is determined by another Fibonacci retracement level, indicating a potential correction. Further support could be found at the low point of March 20, which is $0.5681.
In summary, while XRP has shown resilience by bouncing back from recent lows, it faces significant challenges ahead. Overcoming these hurdles would require strong demand from traders and investors.


0 Comments