Cryptocurrency chart analysis:
 |
| XRP and ETH chart analysis |
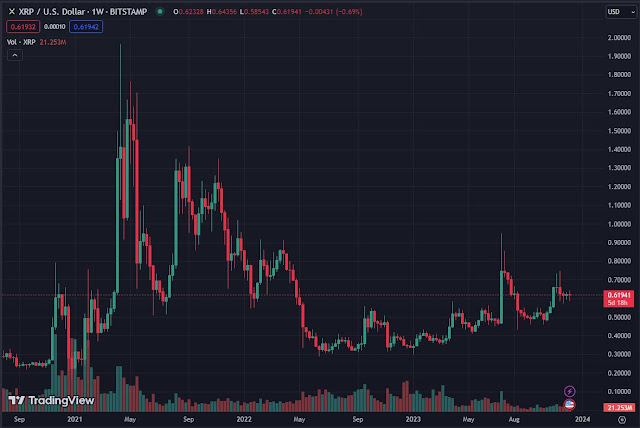
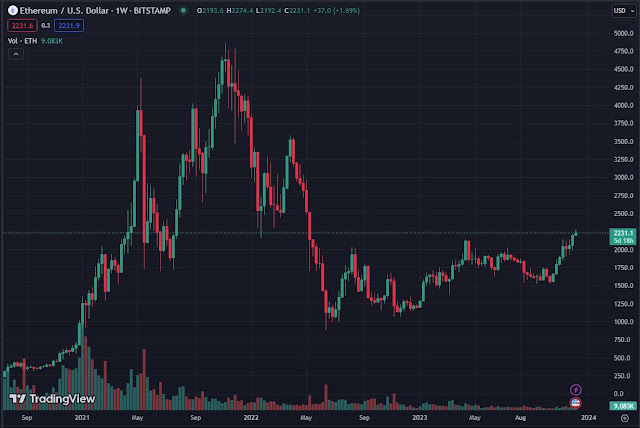
XRP is trading at $0.6232 USD, down 2.43% over the past 24 hours. The 24-hour trading volume for XRP is $1,883,899,609 USD, and the market cap is $33,038,145,433 USD. The circulating supply of XRP is 53,888,571,585 XRP. The 24-hour price activity of Ethereum (ETH) has been relatively stable, with the price fluctuating between $2,071.49 and $2,109.81. The current price of ETH is $2,228.20, which is a 0.14% increase from the previous 24 hours.
XRP crypto analysis:
Since the beginning of December 2023, the price of XRP has been staying below $0.6500. However, XRP is expected to try to go up to $0.7500 again, which it reached on November 13. Right now, it's about 17% away from that goal. The 10-day Exponential Moving Average (EMA) at $0.6209 is providing some support for XRP.
 |
| XRP crypto chart analysis |
As XRP aims for $0.7500, it might face a challenge at $0.6820, which is the 50% retracement level. This level is calculated from the drop between its highest point on July 13 at $0.9403 and the lowest point on August 17 at $0.4237.
If XRP's price goes down, it could find support at the 50-day EMA, which is at $0.6014. However, if the daily candlestick closes below this level, it could mean that the positive outlook for XRP's price might not be valid anymore.
Read more:
Crypto analysis: XRP (Ripple) and Polygon chart analysis
 |
| XRP crypto chart analysis by Cryptocrit |
Ethereum crypto analysis:
Some investors are saying that Ethereum's price has been going up in the past few months and forming a kind of triangle shape. They think that the recent increase in price means it's going to go up even more. While that idea is not entirely wrong, it's a good idea for investors to look at Ethereum's price in a different way.
 |
| Ethereum crypto analysis |
When we look at how much people are selling Ethereum and how Bitcoin's price is not going up as fast, it might be a sign that the price of Ethereum could go down for a short time. Instead of thinking of Ethereum's recent price increase as a triangle, we could see it more like a rising wedge.
Right now, Ethereum is being sold for about $2,230, which is the highest point in this setup. This price matches the middle point of the range, which is also $2,230, making it a difficult level to break through. So, it's likely that the price might go down, especially because a lot of people are moving Ethereum to exchanges. However, even if it goes down in the short term, it might still go up in the long run.
It's not very likely that the price of Ethereum will suddenly drop a lot, given the current conditions in the market. So, the best time to buy Ethereum might be when it reaches the weekly support level of $1,935. If it drops below that, then the best time to buy for long-term investors would be when it reaches the weekly support level, which is between $1,562 and $1,759.
If the price of Ethereum manages to go above $2,230 and stays there, it could go back up to $2,784, which is the highest it has been since May 2022.


0 Comments